Essential Option Trader toolkit & seamless GEX levels for TradingView users
Seamless GEX levels
on your  charts
7-day FREE Trial
We offer Options Toolkit with unmatched functionality for TradingView.
Leverage real options
chain metrics, including ⭐GEX levels, Gamma Flip (HVL), Call/Put Gamma walls, IVrank, IVx and Expected move, DELTA curves and PUT/CALL Volatility Skew to
support
your charting and trading flow.
From now you can access GEX levels
on
your charts
on 220+ implemented US. symbols
You'll never need to switch windows anymore!
Seamless auto-updated GEX levels & options data while charting on TradingView.


Designed by experienced options traders using platforms like TastyTrade, IBKR, TD or ThinkOrSwim but charting technicals on Tradingview
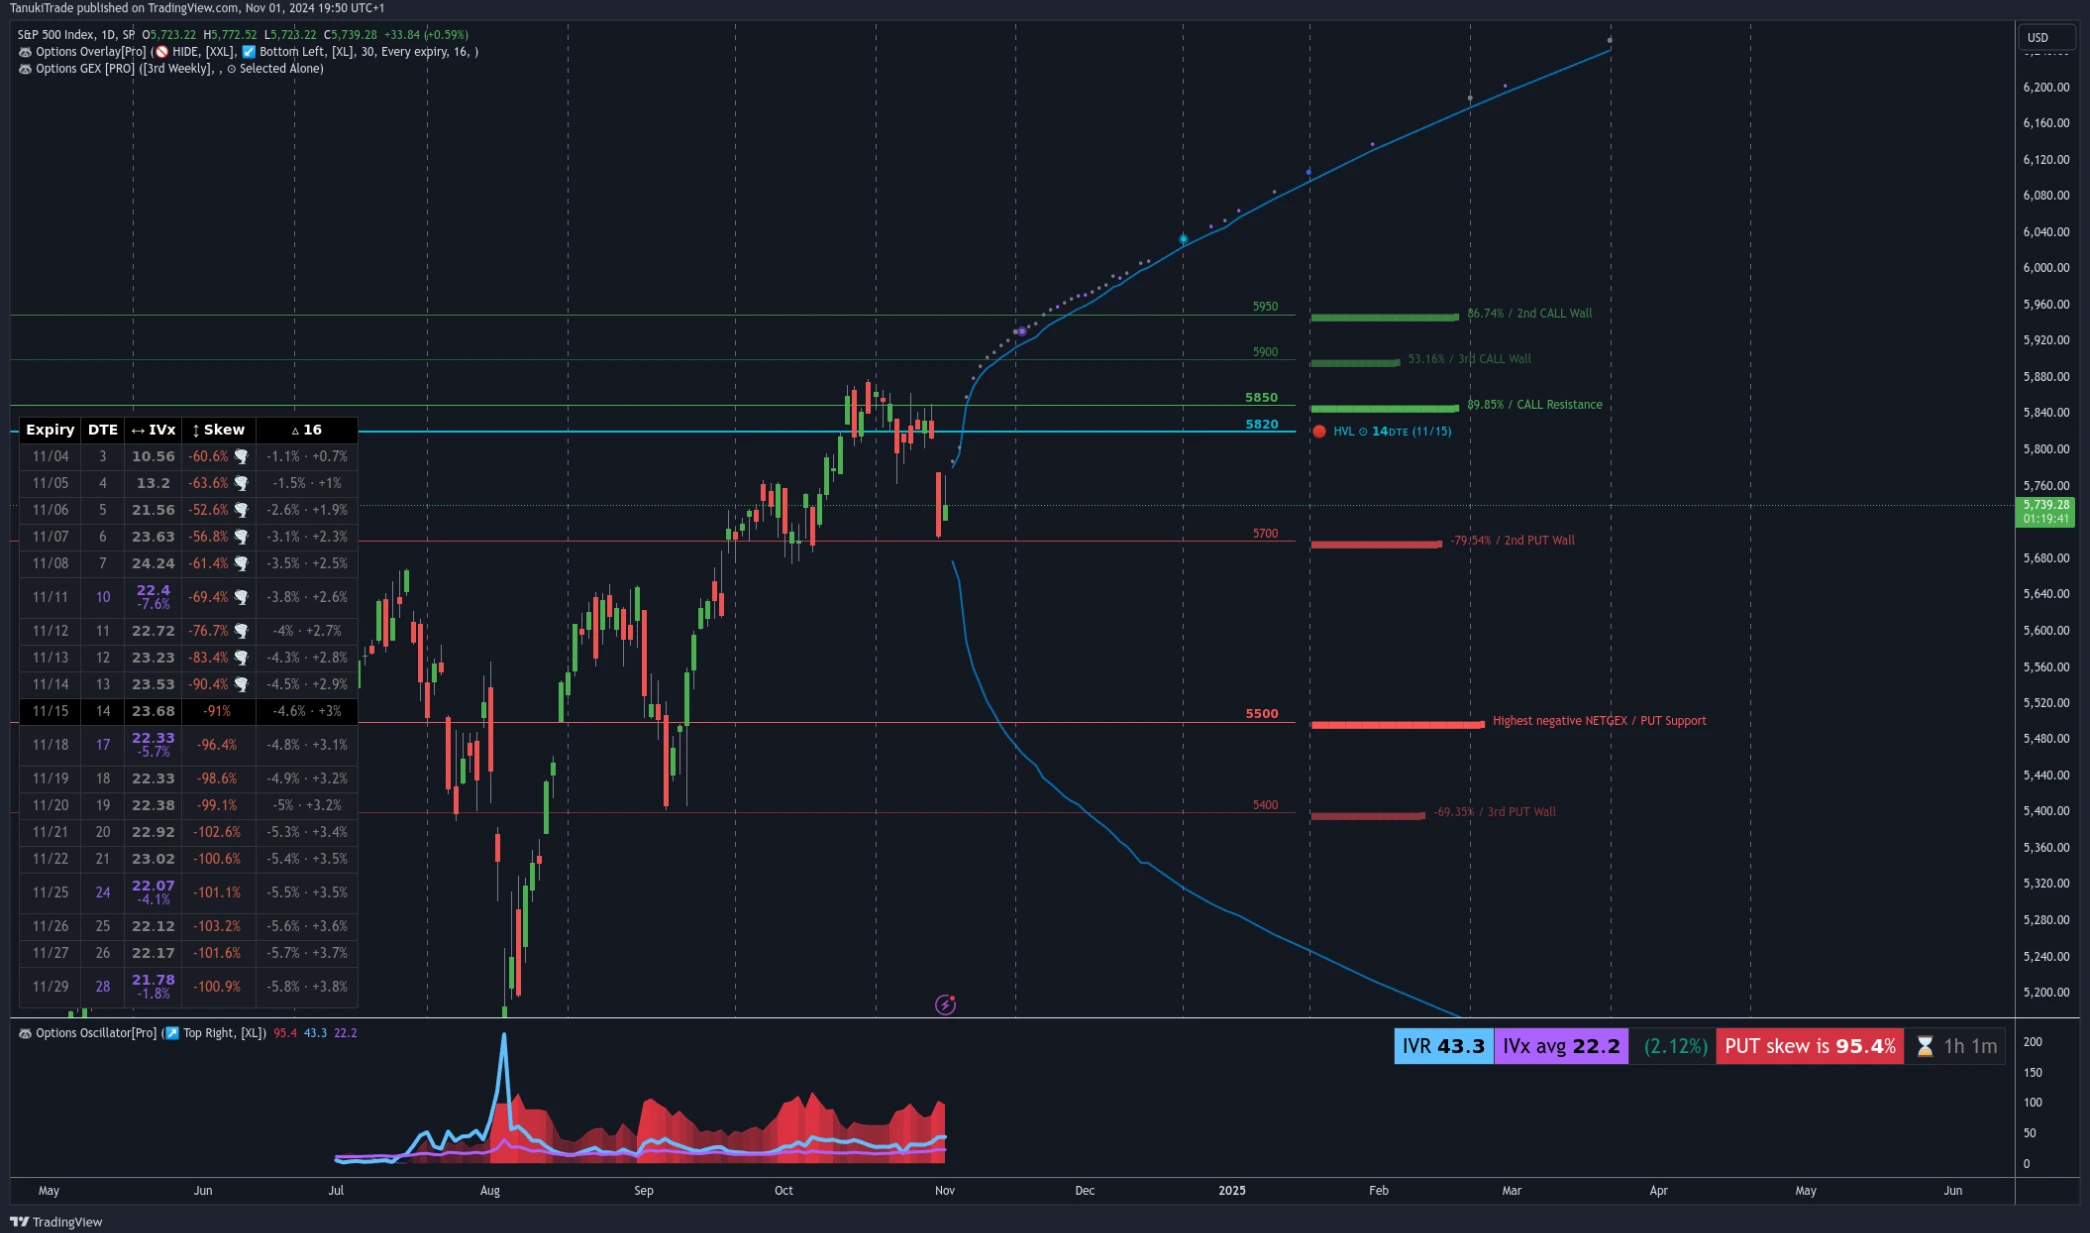
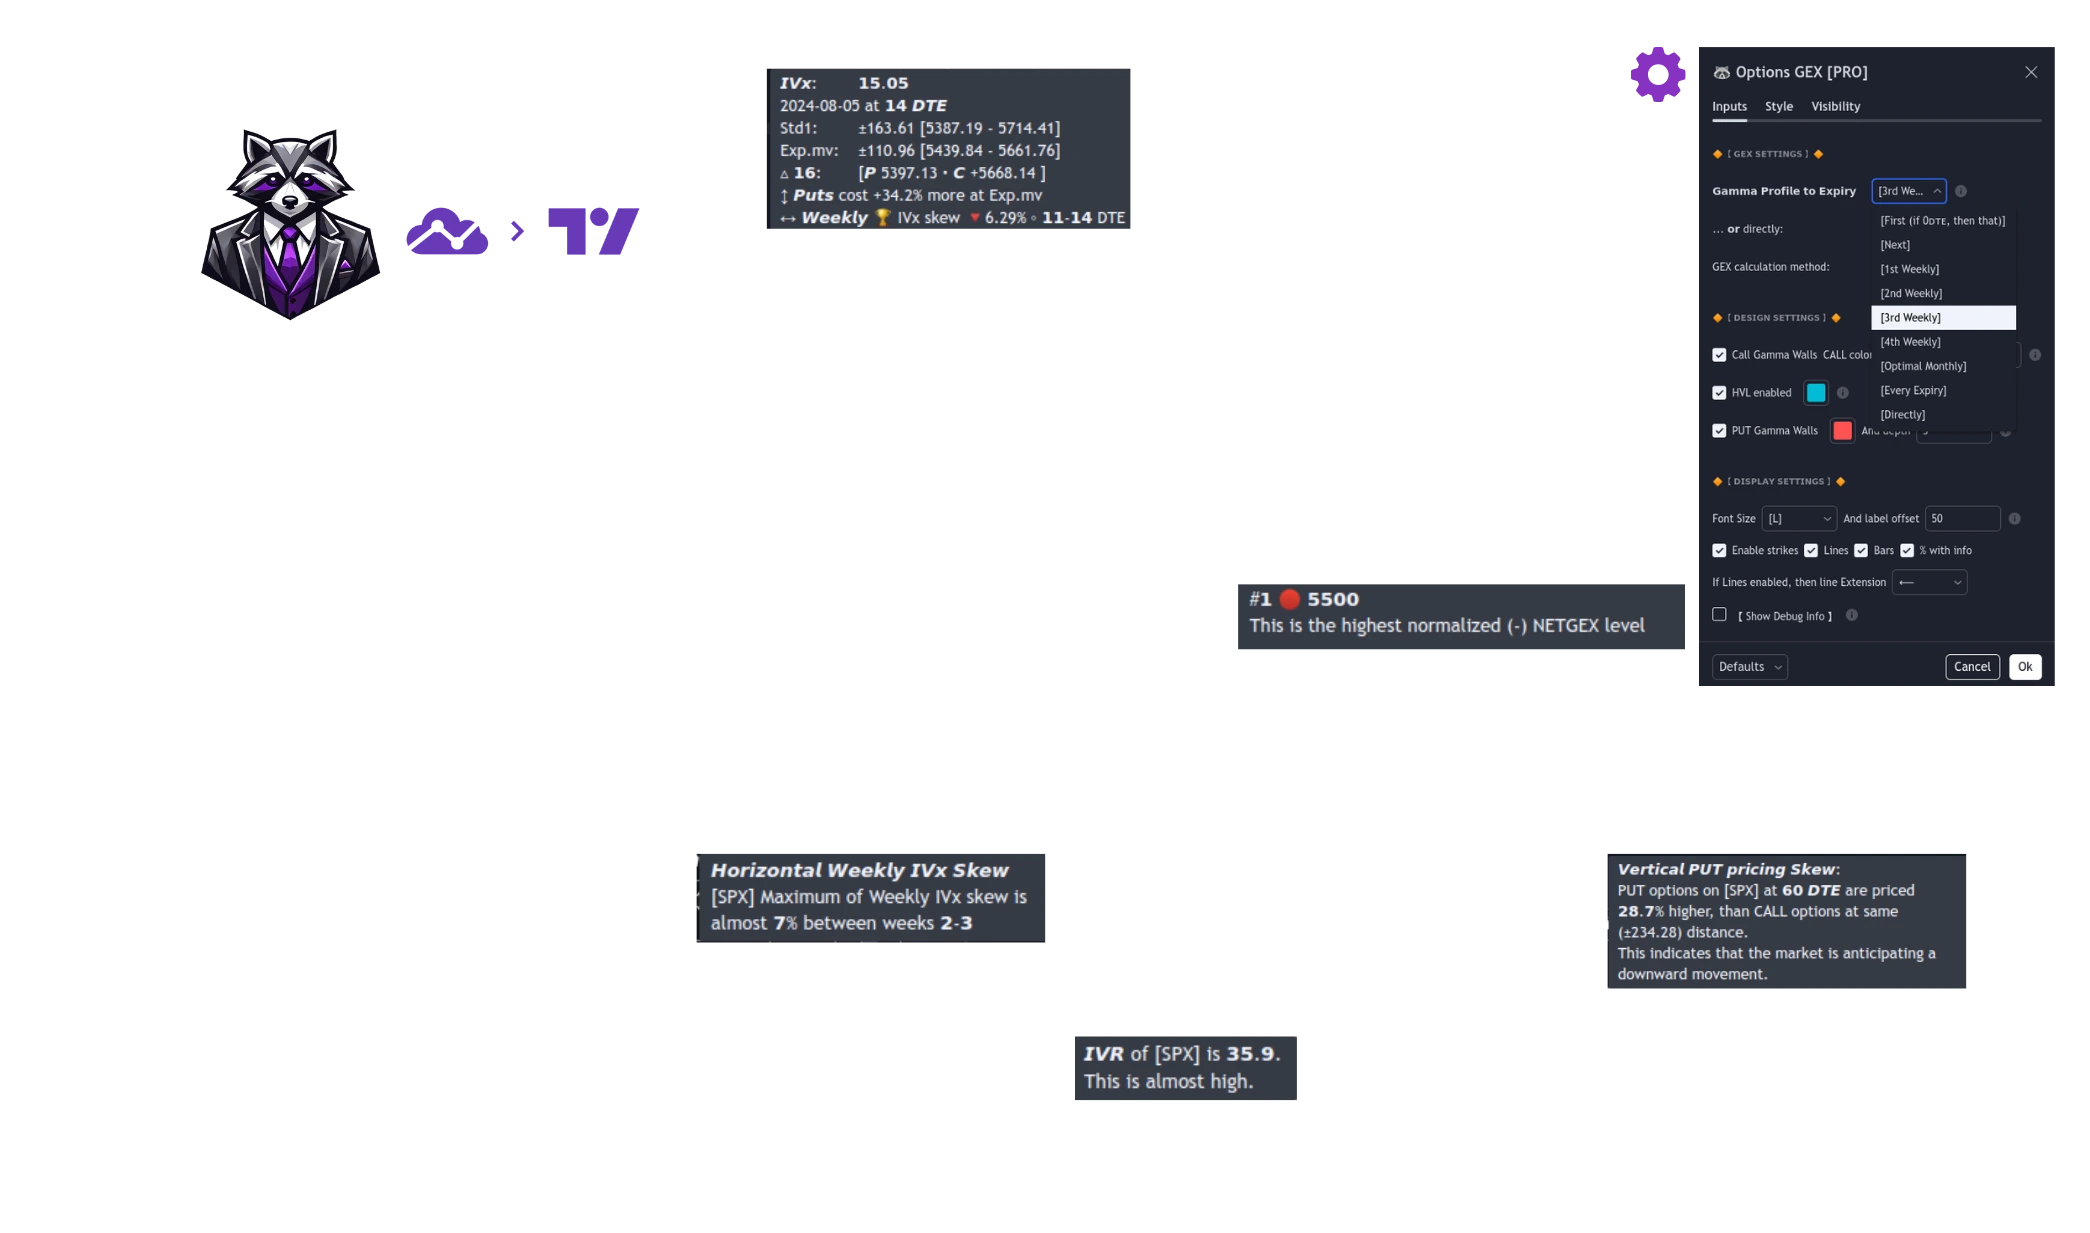
Multi-Expiration Gamma Exposure: Advanced GEX Levels for Options Traders
Get deeper insights with multi-expiration Gamma Exposure (GEX) insights—designed for options traders looking to leverage data across different expirations. Choose the Cumulative (∑) model to view aggregated GEX levels for all expirations or focus on the Selected Alone (⊙) model for insights specific to a single expiration. This advanced indicator highlights Gamma Walls, HVL levels, Put Walls, and Call Resistances, giving you a strategic overview of gamma’s influence on price stability and momentum.
- Aggregate or isolate GEX data by expiration to match your strategy.
- Tailor HVL, Gamma Flip, and Wall levels to focus on your preferred time horizon.
- Seamless auto-updates keep NETGEX, HVL, and CALL/PUT Gamma Wall data accurate throughout the day
Whether you’re targeting short-term momentum or positioning for the long run, our tool’s seamless, 5 times/day auto-update let you make informed decisions confidently.
Maximize 0DTE Strategy with Accurate GEX
Uncover reaction zones and price levels invisible to other indicators. Optimize your 0DTE trades with Gamma Exposure (GEX) analysis, covering Gamma Walls, HVL (Gamma Flip), and Put Walls across 220+ symbols like SPX, SPY, and QQQ. Updated seamlessly day by day, our 0DTE-focused design ensures you’re equipped with up-to-the-minute data, so you can spot every crucial Gamma Flip and resistance level right at market open.
- Get precise GEX data, from Gamma Walls to dynamic HVL levels, for fast-moving 0DTE trades.
- Daily Auto-Updates keep you informed throughout the trading session — no manual refresh needed.
- Market Coverage: 220+ liquid U.S. symbols including 0DTE favorites like SPX, SPY, and QQQ.
With our 0DTE-compatible GEX indicator, you’ll be prepared to react instantly to market shifts, leveraging every advantage to enhance your strategy.
Displaying real PUT/CALL pricing Skew, IVR and IVx Changes
To ensure you instantly see the top-tier data, we’ve developed an oscillator that displays the most important options data immediately in histogram or chart format for 220+ supported US market symbols .
- Histogram and chart displays for quick decision-making
- Get REAL IVRank, IVx, IV change% and CALL/PUT Skew in one place
- No refresh needed—metrics update in real-time
- Histogram and chart displays for quick decision-making
... designed by options traders for fast, actionable insights!
Expiry Table with Real IVx and CALL/PUT Skew Data
By popular demand, we’ve added the Options Expiry Table to the TanukiTrade Toolkit on TradingView for 220+ supported US market symbols
- This table displays the IVx data for the selected symbol
- CALL/PUT pricing skew: the price difference between CALL and PUT options at the same distance
- Color-coded table to help you quickly identify the top-tier important information
- Horizontal IVx Skew helps you easily identify the best spots for timespread trades (Calendar, Diagonal)
- CALL/PUT pricing skew metric displaying skew values for each expiration
The table is updated automatically as you switch between symbols!
We've innovated the probability visualization
Every curve is calculated via Black-Sholes based real option chain data for the given instrument.
- Precise interpolated OTM delta distance curves (blue)
- You can select the preferred 16/20/30 OTM delta range
- Binary Expected move curve for earnings (brown)
- Standard Exp.mv (STD) 1 curve (gray)
Dynamic IVR Dashboard with Auto-Updating Options Metrics
As you switch between the charts of your favorite stocks, the IVR dashboard's automatically updating data changes accordingly. This way, you can always see the following information:
- IVRank with TastyTrade formula
- Implied Volatility average
- Vertical CALL vs. PUT Pricing Skew
- Volatliity skew
- Horizontal IVx Skew (for Calendar + Diagonal strategies)
- ... and detailed tooltip information!
TanukiTrade Web App: Intraday GEX insight without limits
Stay in sync with the market all day long: our standalone web experience streams auto-refreshing GEX intelligence every minute, filling the gaps between TradingView’s five daily refreshes.
-
GEX Live View Watch intraday sentiment update automatically every 60 seconds, complete with zoom controls and expiration-level context.
-
GEX Matrix + Spotlight Search Surface IVx, call/put skew, and expiration impact instantly—swap symbols with Spotlight (Ctrl + K) and keep working.
-
Live Options Screener Filter by Net GEX, Gamma profile, or curated presets; every metric ships with helpful tooltips for fast decisions.
Already a member?
Login to Member Area to get started!
Discord GEX Bots: Fresh Updates Every Minutes—Even Intraday!
Whether you trade 0DTE or swing positions, these new Discord GEX Bots let you react faster to shifting gamma flows. They’re a perfect complement to our TradingView indicators, so dive in and enjoy more frequent GEX insights!
Get GEX visuals every minutes during market hours, independent of TradingView’s 5 daily refreshes.
- Instantly pull up GEX levels by typing Slash “/” Commands in our Discord channel.
- The same coloring you know from TradingView—just updated more often.
- Intraday Focus: Ideal for traders who want near real-time gamma insights between indicator refreshes.
- Dive deeper with NET DEX and NET OI data for more comprehensive GEX analysis.
All PRO subscribers automatically get access to the 🤖│options-gex-bot channel on our Premium Discord. If you already have PRO, jump in and try it out!
Colored and detailed tooltips everywhere
You will be well informed about what you see there and why. For every expiration day we are displaying:
- Exact DTE & Expiry Date
- IVx value of the given expiration
- Vertical CALL vs. PUT Pricing Skew % for the given expiration
- Horizontal IVx Skew %
- ... and detailed interpolated + calculated delta, std1, expmove values!
Build your custom screener or use our build-in preset
The screener aims to offer a comprehensive view of the current state of options for the 220+ implemented instruments, including implied volatility index (IVx), IV rank (IVR), options skew, and expected market movements, which are objectively measured as detailed below. The options metrics displayed may be familiar to options traders from various major brokerage platforms such as TastyTrade, IBKR, TOS, Tradier, TD Ameritrade, Schwab, etc.
Calendar? Diagonal? No problem anymore!
With color-coded labels and insights, we pinpoint the best horizontal IVX skew
dates to give you an edge. Typically, implied volatility (IVx) rises with later expiration dates,
making longer-term options more expensive. But when this trend flips—when IVx drops between two
consecutive expirations—we call it Horizontal Skew or IVx Skew.
This is a top-tier indicator for
mastering Calendar and Diagonal strategies.
How will this toolkit upgrade your charts on TradingView?
Check this out 👇
What our option traders say
Seamless GEX Level Updates for your Tradingview Charts
Simple, All-Inclusive Pricing
Unlock all premium indicators with one PRO membership.
Try all features risk-free with a 7-day free trial—cancel anytime within the trial if you're not satisfied
PRO Quarterly
-15% discount
⭐ 7-day FREE TRIAL, then
Billed $179.9 every 3 months
Seamless GEX updates, auto-refreshed on your TradingView chart 5 times a day
Options PRO Tools (4 TV indicators)
on
220+ U.S. symbols
full
community
access, and complete support
+Extra: GEX Live WebApp — access minute-to-minute refreshed GEX data on Member Area after signup!
PRO Annual
-29% discount
⭐ 7-day FREE TRIAL, then
Billed $599.9 annually
Seamless GEX updates, auto-refreshed on your TradingView chart 5 times a day
Options PRO Tools (4 TV indicators)
on
220+ U.S. symbols
full
community
access, and complete support
+Extra: GEX Live WebApp — access minute-to-minute refreshed GEX data on Member Area after signup!
PRO Monthly
⭐ 7-day FREE TRIAL, then
No discount
Seamless GEX updates, auto-refreshed on your TradingView chart 5 times a day
Options PRO Tools (4 TV indicators)
on
220+ U.S. symbols
full
community
access, and complete support
+Extra: GEX Live WebApp — access minute-to-minute refreshed GEX data on Member Area after signup!
PRO membership includes option metrics for the following tickers and is continuously expanding week-by-week:
- Of course the option allstars: SPX, SPY, QQQ, TLT, GLD, IWM,
- and the following 220+ US Market Symbols and ETFs.
- XSP mapped to SPX using A.I. for GEX levels
- /ES futures mapped to SPX using A.I. for GEX levels
- /NQ futures mapped to QQQ using A.I. for GEX levels
EXTRA: Our Option Trader's Grid System works on every symbol globally, assisting you with
both
targeting and timing (yes, even for futures like /NG, /CL, etc.). However, please note that GEX and
option metrics are not available for futures in our indicators,
except for /ES, /NQ.
For /ES, we
use derived metrics, which are calculated by mapping the /ES current prices to SPX using AI,
leveraging SPX as it represents the largest and most liquid S&P 500 option chain. (Same for /NQ -> mapped to QQQ using AI for GEX levels)
This ensures
precise alignment and accurate GEX level estimations for futures trading. It is important to clarify
that these metrics are derived for /ES and do not use the /ES futures option chain itself.
Plan Comparison
Choose the option that best suits your needs.
Safe and Secure Checkout
7 day FREE Trial granted Cancel anytime in one click from in Member Area. We will send any stuff in 24hrs after signing up.

Any questions?
Check out the FAQs
Still have unanswered questions and need to get in touch?
Still have questions?
Live ChatLet's start your charting easier now!
- Try the TradingView Option Toolset (3 indicators) + GEX Live Webapp FREE for 7 days with 220+ symbols
- SPX, /ES, /NQ, /MES, /MNQ also included via futures mapping
- Daily trade ideas and GEX analysis educational support through our Discord community membership
Cancel anytime during the 7-day trial with no charges or commitments
Try for free now- Try the TradingView Option Toolset (3 indicators) + GEX Live Webapp FREE for 7 days with 220+ symbols
- SPX, /ES, /NQ, /MES, /MNQ also included via futures mapping
- Daily trade ideas and GEX analysis educational support through our Discord community membership
Cancel anytime during the 7-day trial with no charges or commitments
About Us
Meet the team behind TanukiTrade — combining decades of technical expertise and options trading experience to bring you professional-grade tools and education.

Role
Responsible for designing TanukiTrade's data-driven infrastructure, quantitative models, and strategic product direction. Beyond architecting the mathematical, statistical, and technological frameworks, he defines the methodology behind practical decision-support tools, ensuring that the system delivers reliable, interpretable, and effective results in real market conditions.
He oversees the full product development lifecycle—from concept and architecture to final user experience.
Bio
Greg brings over 15 years of experience in the international startup and enterprise technology sector, where he worked as a lead software architect designing complex corporate systems and scalable technology solutions. Throughout his career, he has built data-intensive platforms and business processes that supported high-reliability, high-load operations across multiple countries.
Since 2018, he has been actively involved in options trading, quantitative modeling, and probability-based market analysis. His professional focus includes volatility-driven market structures, theta & gamma dynamics, market microstructure, and automated statistical and mathematical analysis conducted on large datasets. As a quantitative specialist, his goal is to develop models and risk-management frameworks that reliably capture meaningful patterns behind market movements.
As the founder of TanukiTrade, he is dedicated to making modern quantitative analysis and professional options-based thinking accessible to a broader trading community—through intuitive visualizations, transparent models, and effective decision-support tools.
Outside of his professional work, he is passionate about bonsai artistry, tree rescue, and gardening, and is the mindful owner of an energetic dachshund who reminds him daily of the importance of being present. Music, adventure, travel, nature, and exploring the world all play a defining role in his life. He is deeply committed to self-knowledge and personal growth. Creativity and a strong connection to nature shape his everyday life and serve as a constant source of inspiration in his professional thinking as well.


Role
Supports the development of TanukiTrade's options-focused educational framework and contributes to the professional methodology behind the platform's tools and indicators. Ensures that complex option concepts are presented clearly and responsibly, with particular emphasis on risk awareness and structured position-management principles.
Bio
With nearly 20 years of trading experience, Gery has built one of Hungary's most recognized communities in derivatives education. For the past 17 years, he has been teaching options trading full-time, helping thousands of students understand the mechanics, risks, and practical application of options in real-world markets. He is the founder of Hungary's largest options education platform, trusted by a broad audience of retail and advanced traders alike.
Gery's trading style is rooted in swing-based positioning, typically spanning a few days to a few weeks. He specializes in the SPX, focusing on positive-theta spread structures with flat delta exposure, aiming for stable, repeatable outcomes across various market environments.
Beyond trading, Gery is also a developer, having built multiple proprietary options screeners and analytical tools to support his own decision-making. These tools later evolved into widely used scanners and data-driven solutions within his education ecosystem.
Since the very beginning of TanukiTrade, Gery has worked closely with the founder, Greg, as a senior professional advisor, helping with the platform's strategic direction and the development of its options-related concepts.
Outside the world of trading and technology, Gery is dedicated to personal growth and meaningful experiences. He loves exploring new places, practicing self-development, and spending quality time with his family. Sports play an important role in his life as well — especially table tennis, swimming, and skiing — helping him maintain balance, focus, and long-term resilience both on and off the markets.