
Learn
Chain Activity
The sidebar card compares the open-interest book with today's volume. It is a description of the chain. The card says so: not a directional signal.
Two lanes share a scale. Left of center is put-heavy, the middle tick is a call/put ratio of 1.00, and the right side is call-heavy. The scale is logarithmic so a large call-side ratio still fits. The top lane (OI BASE) is open interest, marked with a gold pin. The bottom lane (VOL TODAY) is session volume, marked with a dot: green when calls lead, red when puts lead, and gray when the ratio is near 1.
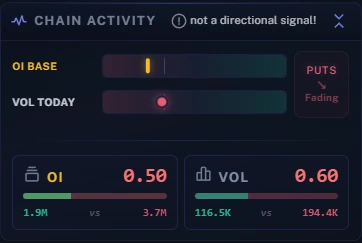
Example: reading a PUTS · Fading card
Both lanes sit to the left of the center 1.00 tick, so both the existing book and today's flow are put-heavy—but today's volume is less skewed than open interest:
- OI Base (
0.50):1.9Mcalls versus3.7Mputs (roughly two puts open for every call), placing the gold pin well into the put-heavy side. - Vol Today (
0.60):116.5Kcalls versus194.4Kputs. Puts still lead today's trading, so the dot stays red, but it sits closer to the center tick than the OI pin. PUTS ↘ Fadingbadge: because both lanes lean toward puts while today's volume ratio (0.60) is less extreme than the open-interest baseline (0.50), the card labels the put skew as Fading.
The right-hand badge pairs the active lean (CALLS, PUTS, or BALANCED) with one of four flow states:
- Shift — volume leans the opposite way from open interest.
- Accel — volume leans the same way and is more skewed than open interest.
- Fading — volume leans the same way, but is less skewed than open interest (as in the example above).
- Stable — the two leans closely agree, or both sit near balanced.
Before 9:30 AM ET the volume lane reflects the prior session, and the card notes that state. The card hides when an expiration has no open interest, and it also updates when stepping through GEX History/Replay.
Read a shift as a comparison
If the OI lane is put-heavy while the volume lane is call-heavy, the card describes a difference between outstanding contracts and session activity. It does not establish that existing put positions were closed or that fresh bullish positions were opened.
Rolling spreads, closing calls, or hedging other exposure can all contribute to call volume. Compare the distribution by strike and expiration in Column metrics before attaching a narrative to an aggregate badge.
Where you see it
- GEX Live Table and GEX Live Chart Details sidebar
- GEX History/Replay
TanukiTrade documentation. Levels are context, not a recommendation. tanukitrade.com